
image credit: www.atlallday.com
I’m going to keep this short and sweet. I am going to update the data used within this article every week through early September. However, I won’t edit the audio or text…so some things won’t match the figures. To stick with the theme of being short and sweet…I’m adding the dashboard below to highlight the rankings you should use. The dashboards below this one will dive into a bit of who is over/under ranked. Enjoy!

—legacy material below—
Audio Summary
Note: descriptive text is replicated across all “draft analysis using DVI” articles- except the dashboards and the comments about the Top x players
Many of us face a fatal flaw in our reasoning every draft. We place additional value on certain players just because of _____, or nothing. It’s as if some players had their own marketing departments designed to convince us that their player is better than they actually are.
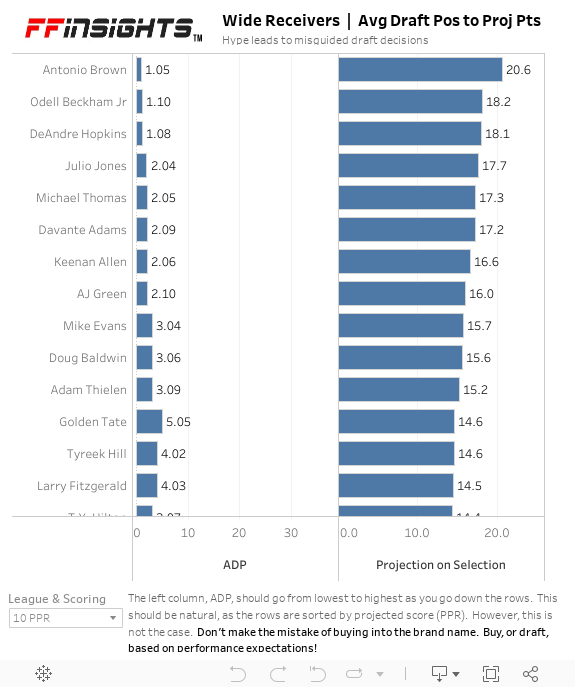
The exhibit below shows three columns: 1) where players are projected to be drafted (ADP), 2) projected score in PPR and 3) projected score in standard. One would expect that the order of drafting would follow the projected score. However, this isn’t the case in practice. Perhaps we drop some simply due to injury risk. I can believe this for a player like Andrew Luck. But can this possibly be true for all of the abnormalities? I think not. There’s something else at play: a fatal flaw. It is also interesting to me to see such considerable gaps in ADPs, while the projected points are a rather gradual decline. You would expect defined tiers at the position with such gaps in ADP.
I will venture to throw it out there that some people would pick Marshall Faulk before round 3 if he came out of retirement tomorrow. This is part of the fatal flaw in action. We just want some things to be true, even if data isn’t there to back us up on the decision.
Let’s look at a few of our fatal flaws in action in the quarterback ranks, specifically the Top 10 in 10-man leagues (PPR and standard will be identical for QBs):
Tier 1 (Antonio island)
1) Antonio Brown is alone in this tier. I feel that it’s important to look at the dashboard to truly have a been feeling on the differences between players (and believe that gets lost with “tiers”. That said, I’m doing it anyway
Tier 2 (a slight plateau for these five, as they’re separated by roughly a point per game)
2) Julio Jones should be the second WR off the board. I expect that the contract talks is the cause of this drop. Most likely that will be resolved and he will just a little by the time most drafts are underway (I’ll update this article around the first week of August)
3) DeAndre Hopkins
4) Keenan Allen proved to be my easy pick last year to get an advantage over others in drafts. The secret is no longer and we’ll have to pay full price this year
5) Michael Thomas
6) Odell Beckham Jr. is the last of Tier 2 before the drop to Tier 3. I’d love to bump him up for style points…some of his catches are epic
Tier 3 (mainly a gradually declining slope through this group)
7) AJ Green
8) Davante Adams
9) Adam Thielen
10) T.Y. Hilton note the better ranking in standard due to scoring systems
11) Larry Fitzgerald has the opposite story to that of T.Y. Hilton. PPR scoring loves him. Pay attention and draft per your league’s scoring system (and note the ability to adjust the sort by clicking above the label in the standard column to switch over from PPR)
12) Mike Evans
13) Tyreek Hill is Mr. Everything in Kansas City and can only be limited by a new QB in town
14) Demaryius Thomas
15) Doug Baldwin
16) Stefon Diggs
17) Allen Robinson
18) Josh Gordon
19) Golden Tate is yet another reminder: use rankings consistent with your league’s scoring system!
20) Juju Smith-Schuster is yet another Steeler receiver to make this top WR list. The lead back in Pittsburgh isn’t half bad at catching the ball either. It’ll be a surprise if this crew doesn’t pull Big Ben into the Top 10 QBs at the end of the year
21) Alshon Jeffery
22) Amari Cooper
23) Jarvis Landry
24) Emmanuel Sanders
25) Pierre Garcon
Note the lessons learned article HERE and the fact that only 4 out of 10 preDraft Top 10 WRs in ’17 ended up in the Top 10. Those staying in the Top 20 is quite a bit more accurate with 65% (PPR) and 55% (standard) keeping their real estate deal in that Top 20 group by the end of the regular fantasy season. In other words, this whole rankings thing should be taken with a grain of salt. To clarify, I am using aggregate rankings of many analysts. This 40% accuracy isn’t just for my rankings. All of the certainty in the world given to you by any analyst should give you pause, where you realize that they’ll likely be correct only half of the time.
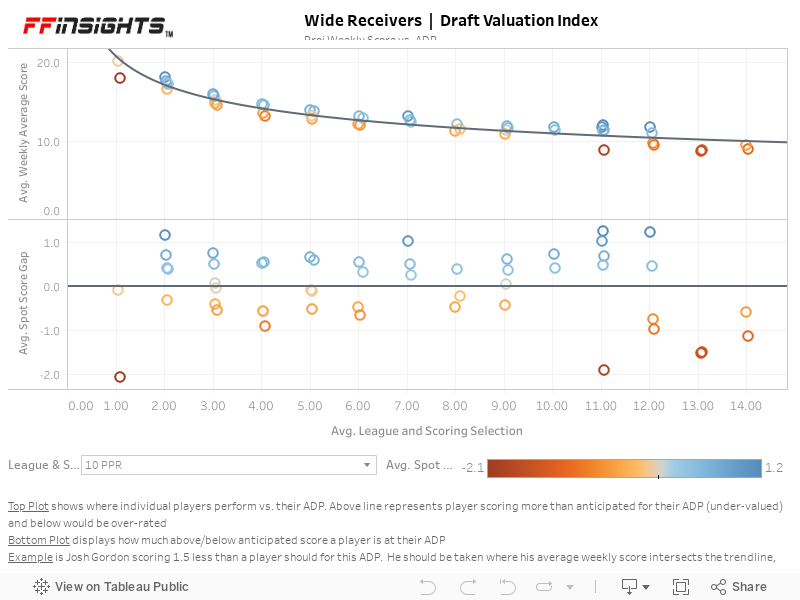
Warning: This next section requires a little more mental effort and patience. We’ve talked about the fatal flaw. We can see that comparing ADP to projected scores is helpful to understand the fatal flaw. However, this doesn’t really tell us when players should be drafted. We only know the order.
Essentially, this analysis includes the following steps:
1) Get projection data (aggregated across as many analyst rankings as possible)
2) Get average draft position for all actual (or anticipated drafts)
3) Plot 1 vs. 2 to determine a best fit equation for their relationship
4) Determine how each player varies from this best fit equation
5) Gather insights from that variation in 4 (above line is under-rated and below is over-rated)
Note that all of that coming together forms the ever-so-cool sounding acronym DVI, or Draft Valuation Index
There are some helpful hints in the tooltip (the mouse-over pop-up when you interact with the dashboard). The top two rows will share the weekly projected score for PPR and standard. You will also see the difference in points from that specific player’s weekly projection, by scoring system, to the average of the position. Note that the average of the position is based on the top ten tight ends, as this is the primary group of interest in traditional fantasy lineups. The plot boils down to what is provided in the third line of the tooltip. This expresses how players relate to the DVI fitted equation. If the player is above it, he’s a value pick. In other words, you have a player scoring more than they should for that draft pick. If below the line, that player is over-rated. An additional bonus is that not only do you know if the player is over/under-rated- but you know how much they are in either direction. The difference between what they should score (for that purchase, or draft, price) vs. the projected (weekly) score is provided for each player. Note that you can toggle between different scoring league types as well within the drop-down on the dashboard.
The second plot shows this gap a little more clearly. You can see that gap vs. a horizontal line with a fixed axis.

In summary, incorporate the following into your draft(s)
1) Be objective and make decisions based on data and not emotion- avoid the fatal flaw
2) Take advantage of others’ inability to avoid the fatal flaw- better players will fall to later rounds in the draft
3) Always aim for the most value at every pick. There are two metrics to keep near the top of your list: 1) how the player compares to what they should score at a given draft spot (represented by the distance above or below the line in the DVI plot and 2) advantage over the average player at that position.
Note that data used in this analysis was extracted on June 29th. The values used are subject to change, as I will be updating the data source closer to the draft with a fresher update on the data source.