

image credit: www.sun-sentinel.com
I’m going to keep this short and sweet. I am going to update the data used within this article every week through early September. However, I won’t edit the audio or text…so some things won’t match the figures. To stick with the theme of being short and sweet…I’m adding the dashboard below to highlight the rankings you should use. The dashboards below this one will dive into a bit of who is over/under ranked. Enjoy!
—legacy material below—
Audio summary
Note: descriptive text is replicated across all “draft analysis using DVI” articles- except the dashboards and the comments about the Top x players
Many of us face a fatal flaw in our reasoning every draft. We place additional value on certain players just because of _____, or nothing. It’s as if some players had their own marketing departments designed to convince us that their player is better than they actually are.
The exhibit below shows three columns: 1) where players are projected to be drafted (ADP), 2) projected score in PPR and 3) projected score in standard. One would expect that the order of drafting would follow the projected score. However, this isn’t the case in practice. Perhaps we drop some simply due to injury risk. I can believe this for a player like Andrew Luck. But can this possibly be true for all of the abnormalities? I think not. There’s something else at play: a fatal flaw. It is also interesting to me to see such considerable gaps in ADPs, while the projected points are a rather gradual decline. You would expect defined tiers at the position with such gaps in ADP.
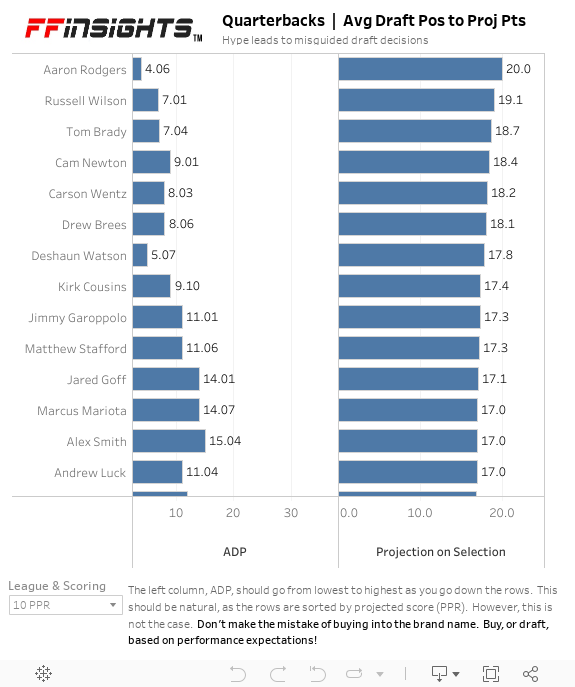
I will venture to throw it out there that some people would pick Marshall Faulk before round 3 if he came out of retirement tomorrow. This is part of the fatal flaw in action. We just want some things to be true, even if data isn’t there to back us up on the decision.
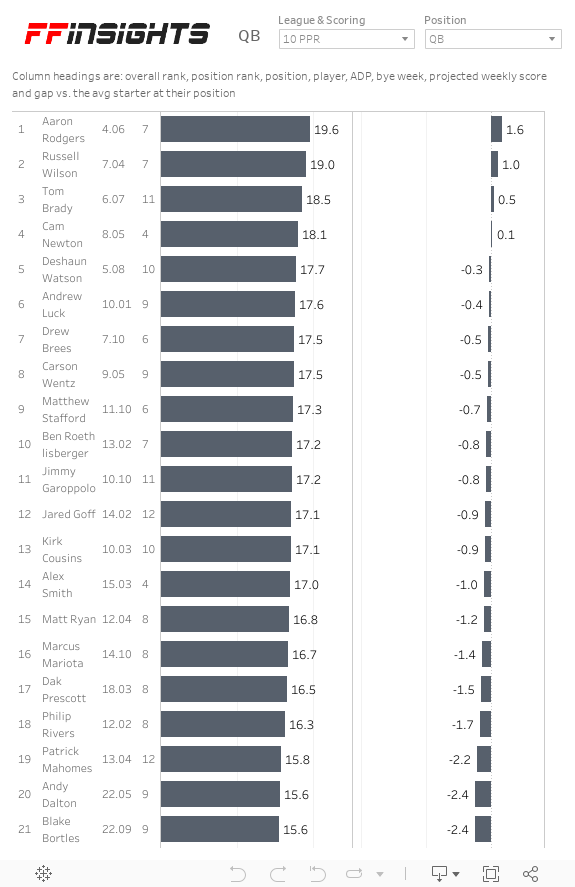
Let’s look at a few of our fatal flaws in action in the quarterback ranks, specifically the Top 10 in 10-man leagues (PPR and standard will be identical for QBs):
1) Aaron Rodgers is slightly (just 0.3 points per game) under what you should expect for his current draft position
2) How is it that Tom Brady is under-rated?! He should jump up to the #2 QB and get taken in the 5th vs. the 7th
3) Russell Wilson should move up to #3 and could be taken a few (but not many) spots earlier into the mid 6th vs. the 7th round
4) Carson Wentz is roughly placed right where he should be in the seventh
5) Deshaun Watson is quite over-rated per current projections. He was doing quite well prior to his exit, due to injury, last year. However, it appears most analysts are expecting him to regress to the mean. He is expected to be the #5 QB- and should be taken in the 7th vs. the 5th round
6) Cam Newton can jump Drew Brees and go in the 8th
7) Alex Smith is the diamond in the rough in the QB group. He’s all the way down in round 16 and is expected to be 7th overall. He exceeded expectations last year by far. Oddly, expectations are high- but it isn’t reflected in the ADP. Take advantage of it!
8) You can wait till the 7th to take Drew Brees
9) Kirk Cousins is fine to take as currently going in the 10th
10) Andrew Luck is potentially a steal as the #10 QB in projections. He is obviously a high risk- but could be justified as a 10th rounder vs. 12th
Note the lessons learned article HERE and the fact that only 5 out of 10 preDraft Top 10 QBs in ’17 ended up in the Top 10. In other words, this whole rankings thing should be taken with a grain of salt. To clarify, I am using aggregate rankings of many analysts. This 50% accuracy isn’t just for my rankings. All of the certainty in the world given to you by any analyst should give you pause, where you realize that they’ll likely be correct only half of the time. Who are the potentials to sneak into the Top 10? Well, I have my eyes on three (four actually): Ben Roethlisberger, Philip Rivers and a Matt.
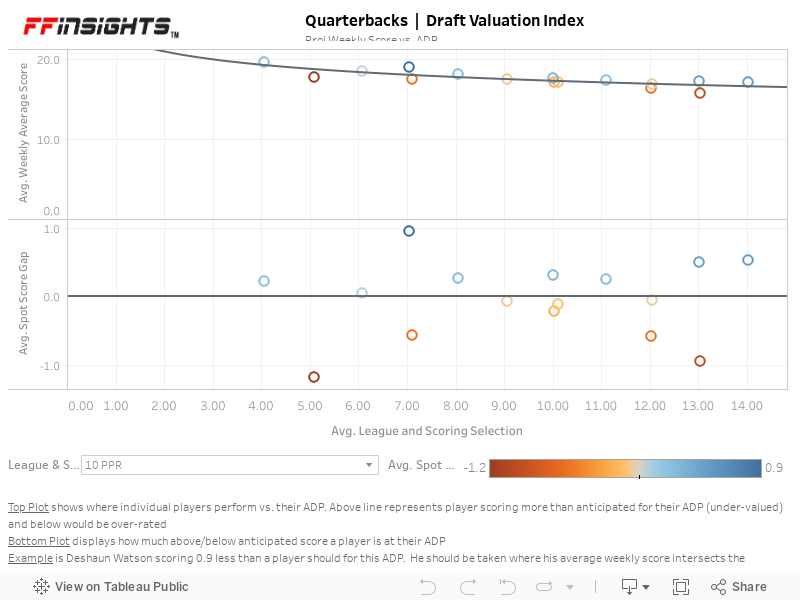
Warning: This next section requires a little more mental effort and patience. We’ve talked about the fatal flaw. We can see that comparing ADP to projected scores is helpful to understand the fatal flaw. However, this doesn’t really tell us when players should be drafted. We only know the order.
Essentially, this analysis includes the following steps:
1) Get projection data (aggregated across as many analyst rankings as possible)
2) Get average draft position for all actual (or anticipated drafts)
3) Plot 1 vs. 2 to determine a best fit equation for their relationship
4) Determine how each player varies from this best fit equation
5) Gather insights from that variation in 4 (above line is under-rated and below is over-rated)
Note that all of that coming together forms the ever-so-cool sounding acronym DVI, or Draft Valuation Index
There are some helpful hints in the tooltip (the mouse-over pop-up when you interact with the dashboard). The top two rows will share the weekly projected score for PPR and standard. You will also see the difference in points from that specific player’s weekly projection, by scoring system, to the average of the position. Note that the average of the position is based on the top ten tight ends, as this is the primary group of interest in traditional fantasy lineups. The plot boils down to what is provided in the third line of the tooltip. This expresses how players relate to the DVI fitted equation. If the player is above it, he’s a value pick. In other words, you have a player scoring more than they should for that draft pick. If below the line, that player is over-rated. An additional bonus is that not only do you know if the player is over/under-rated- but you know how much they are in either direction. The difference between what they should score (for that purchase, or draft, price) vs. the projected (weekly) score is provided for each player. Note that you can toggle between different scoring league types as well within the drop-down on the dashboard.
The second plot shows this gap a little more clearly. You can see that gap vs. a horizontal line with a fixed axis.

In summary, incorporate the following into your draft(s)
1) Be objective and make decisions based on data and not emotion- avoid the fatal flaw
2) Take advantage of others’ inability to avoid the fatal flaw- better players will fall to later rounds in the draft
3) Always aim for the most value at every pick. There are two metrics to keep near the top of your list: 1) how the player compares to what they should score at a given draft spot (represented by the distance above or below the line in the DVI plot and 2) advantage over the average player at that position.
Note that data used in this analysis was extracted on June 29th. The values used are subject to change, as I will be updating the data source closer to the draft with a fresher update on the data source.